 Wheeler Works
Monte Carlo Sheets
Monte Carlo Sheets is a free retirement simulator that lives entirely in a Google Sheet. It stress-tests your retirement plan against 150+ years of real market history — running 1,000 simulated retirements built from actual stock, bond, and inflation sequences (1871–present), not idealized bell curves. Pick from five withdrawal strategies (the 4% rule, Guyton-Klinger guardrails, VPW, and more) and three allocation strategies, then see how often your plan survives — and when a simulated retirement fails, drill into the exact year-by-year path and let AI explain what killed it and which changes would actually have saved it, backed by replayed numbers rather than guesswork. Make a copy of the template and everything — your finances, your results — stays in a spreadsheet only you own.
Get it: Google Sheets template (link) · Free · Runs in Google Sheets — nothing to install · Your data stays in your own spreadsheet · Make your own copy of the sheet and follow the “How to use” instructions
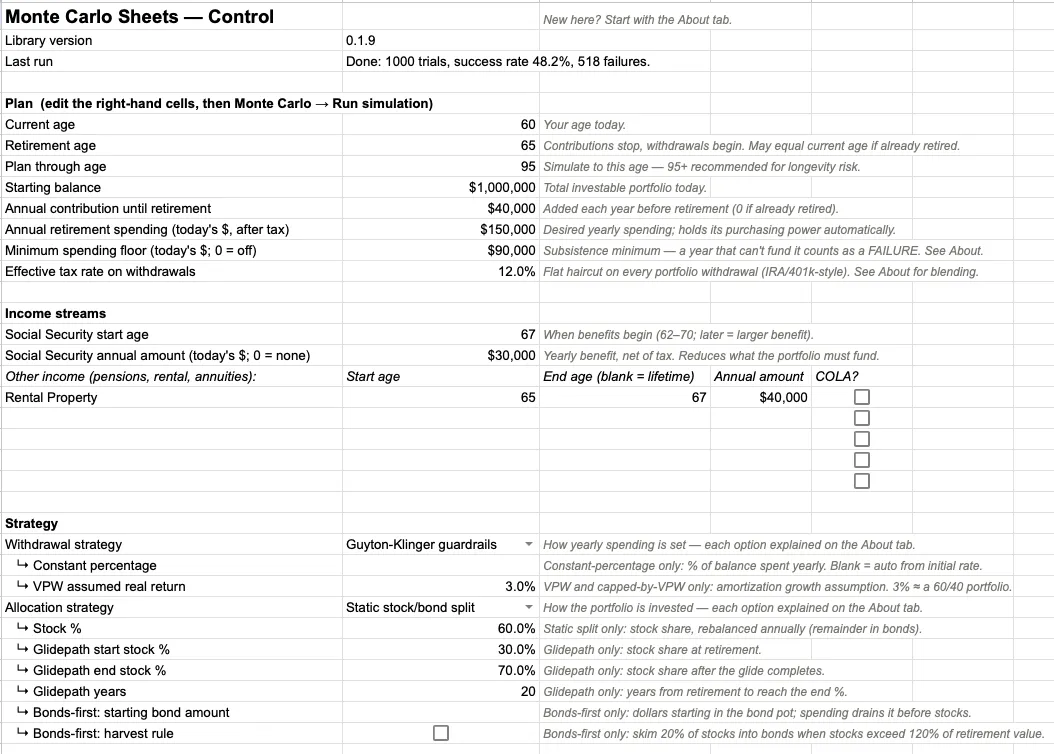 The Control tab — your whole plan on one sheet: ages, balance, spending, Social Security and pensions, tax rate, and the strategy pickers, each input explained in place.
What it is
Monte Carlo Sheets answers the question every retirement plan hangs on: “Will my money last?” — and, more usefully, “when it doesn’t, why not, and what would have fixed it?”
Instead of assuming markets follow a tidy statistical curve, it samples blocks of consecutive real history from Robert Shiller’s 1871–present dataset: actual crashes, actual inflation decades, actual recoveries, kept in their real-world order so the multi-year bad stretches that genuinely sink retirements — 1929, the 1970s, 2008 — appear in the simulations with full force. Every run simulates 1,000 complete retirements in seconds, all in inflation-adjusted dollars, so “spending $40,000 a year” always means today’s purchasing power.
Strategies worth comparing
How you withdraw matters as much as how much you have. Monte Carlo Sheets ships five withdrawal strategies and three allocation strategies, all combinable:
- Constant dollar (the real 4% rule) — the same inflation-adjusted amount every year, regardless of markets.
- Guyton-Klinger guardrails — spending cuts when the portfolio struggles, raises when it prospers; the approach most professional planning tools use.
- Constant percentage — a fixed share of the current balance; can’t run out, but income swings with markets.
- VPW — amortizes the portfolio over your remaining years, like a mortgage in reverse.
- Constant dollar capped by VPW — spend your plan, but never more than the amortization allows: cuts arrive before depletion is possible, and good-market surpluses compound untouched for your heirs.
Allocations: a classic static split, a glidepath (rising or declining equity), or bonds-first — separate stock and bond pots where spending drains bonds before a single share of stock is sold, with an optional harvest rule that skims big stock gains back into the bond buffer.
A spending floor keeps the adaptive strategies honest: spending never drops below your subsistence minimum, and a year that can’t fund the floor counts as a failure — no strategy gets to “survive” on un-liveable income. Because runs are seeded and reproducible, two strategies can be compared against identical market sequences: the difference you see is pure strategy, not luck.
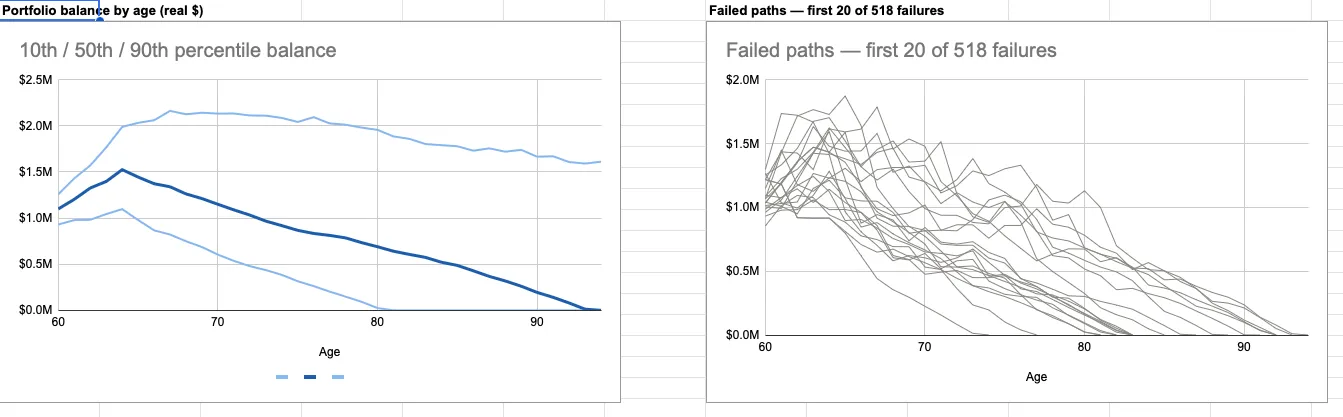 The Dashboard — the 10th/50th/90th percentile balance by age, with every failed path drawn alongside so you can see exactly where plans go wrong.
See the failures, not just the odds
Most Monte Carlo tools hand you a single success percentage and stop. Monte Carlo Sheets treats the failures as the interesting part:
- The Failures tab lists every failed trial — the age it failed, how long it survived, its worst drawdown, and which historical era its returns were drawn from (“this one retired into 1966”).
- Drill into any trial — failed or successful — for a year-by-year account: balance, returns, income, withdrawals, and the exact historical years each step was sampled from, with a chart of the path.
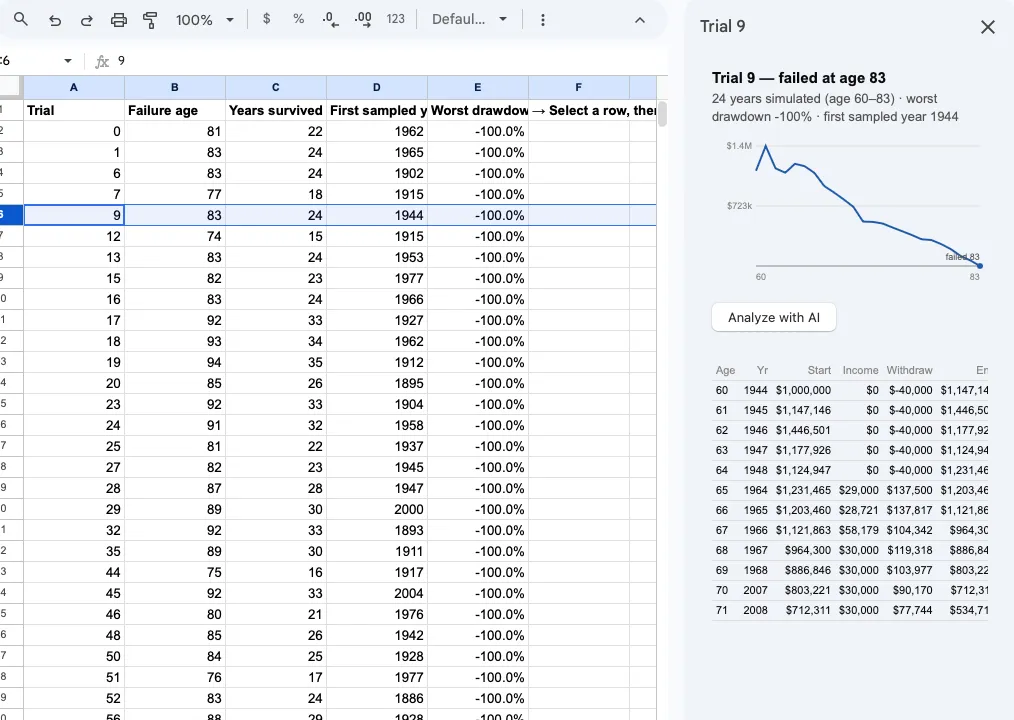 The drill-down sidebar — one simulated retirement, year by year: what the market did, what was withdrawn, and where it came apart.
AI analysis that shows its work
Select any failed trial and ask for an analysis. Before a single word is written, the simulator replays that trial’s exact market sequence under alternative strategies — spend 10% less, switch to guardrails, delay Social Security two years, hold a ten-year bond buffer, retire two years later — and records what each would have done: survived, or failed later, and with how much.
Only then does Claude (Anthropic’s AI) write the analysis: why this path failed — sequence risk, overspending, inflation — and which fixes would actually have worked, ranked by the replayed numbers, not by plausible-sounding advice. “Spending 10% less still fails at 88; delaying Social Security two years survives with $310,000 to spare” is a different kind of answer than “consider spending less.” The write-up lands on its own tab, one section per analyzed failure.
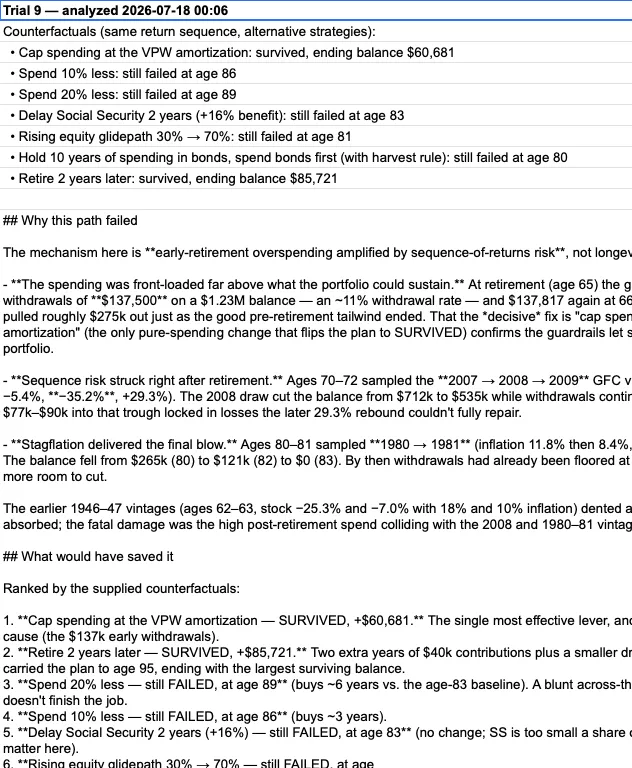 An AI failure analysis — the failure mechanism explained, and every candidate fix scored by actually re-running the same market sequence with that change.
Your data stays yours
The template’s design keeps your finances private by construction:
- You own the spreadsheet. Make a copy of the template and everything — inputs, results, analyses — lives in a Google Sheet in your Drive that nobody else can read.
- Nothing is collected. There’s no backend, no telemetry, no account beyond the Google login you already have.
- AI is optional and yours to control. Analyses use a shared key by default; paste your own Anthropic API key (stored only in your copy) to use yours instead. The simulation itself never needs a key at all.
- Always current. The logic lives in a shared script library, so improvements arrive automatically — no re-copying, no updates to install.
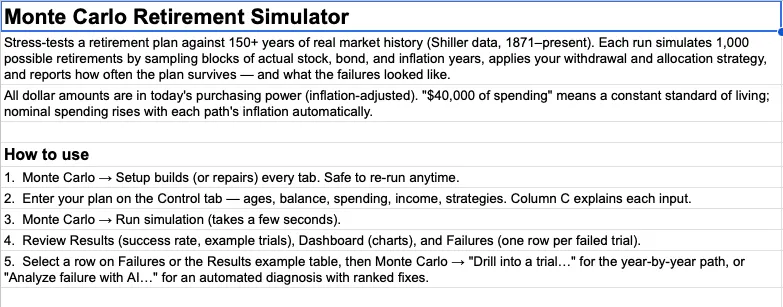 Built-in documentation — every strategy, every input, and concepts like block bootstrapping and the spending floor, explained inside the sheet itself.
Getting started
- Open the template: Monte Carlo Sheets template. It’s view-only — that’s expected; you’ll work in your own copy.
- Make your copy: File → Make a copy (sign in to Google if prompted), name it whatever you like, and open the copy from your Drive. This copy is entirely yours — your inputs and results are visible to no one else.
- Authorize on first use: in your copy, open the Monte Carlo menu (next to Help; reload the tab if it hasn’t appeared yet) and click Setup. Google will ask you to authorize the script. Because it’s an independent tool rather than a published Google app, you’ll see a “Google hasn’t verified this app” screen — click Advanced → Go to (project) → Allow. The permissions are limited to this one spreadsheet plus the web request that powers the AI analysis.
- Run it: if Setup was interrupted by the authorization step, run Monte Carlo → Setup once more. Then enter your plan on the Control tab and click Monte Carlo → Run simulation. Results arrive in seconds.
An About tab documents every strategy and input, and each Control cell carries a one-line explanation — no manual required. Improvements ship automatically to every copy, so you never need to re-copy the template.